

It’s been extremely common for news accounts to portray Donald Trump’s candidacy as a “working-class” rebellion against Republican elites. There are elements of truth in this perspective: Republican voters, especially Trump supporters, are unhappy about the direction of the economy. Trump voters have lower incomes than supporters of John Kasich or Marco Rubio. And things have gone so badly for the Republican “establishment” that the party may be facing an existential crisis.
But the definition of “working class” and similar terms is fuzzy, and narratives like these risk obscuring an important and perhaps counterintuitive fact about Trump’s voters: As compared with most Americans, Trump’s voters are better off. The median household income of a Trump voter so far in the primaries is about $72,000, based on estimates derived from exit polls and Census Bureau data. That’s lower than the $91,000 median for Kasich voters. But it’s well above the national median household income of about $56,000. It’s also higher than the median income for Hillary Clinton and Bernie Sanders supporters, which is around $61,000 for both.
These figures, as I mentioned, are derived from exit polls, which so far have been conducted in 23 primary states.1 The exit polls have asked voters to describe their 2015 family income by using one of five broad categories, ranging from “under $30,000” to “$200,000 or more.” It’s fairly straightforward to interpolate a median income for voters of each candidate from this data; for instance, we can infer that the median Clinton voter in Wisconsin made about $63,000.2 You can find my estimates for each candidate in each state in the following table, along with each state’s overall household median income in 2015.3
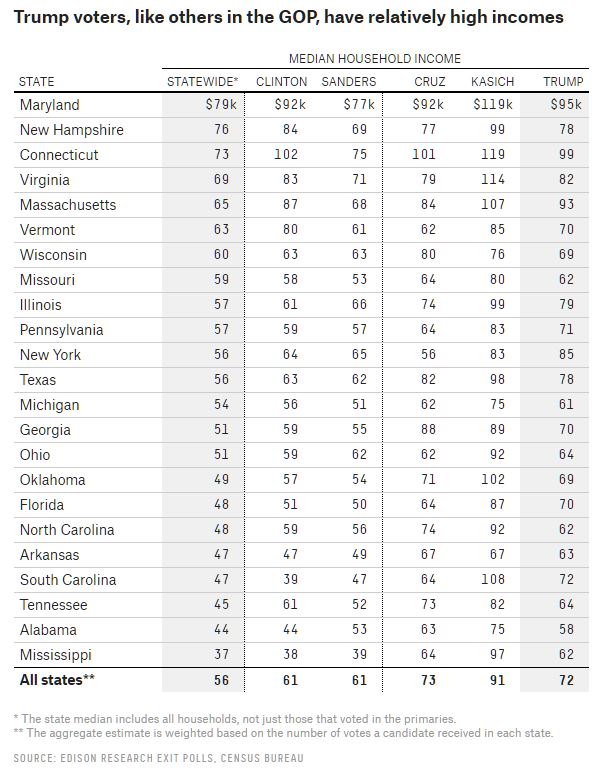
Trump voters’ median income exceeded the overall statewide median in all 23 states, sometimes narrowly (as in New Hampshire or Missouri) but sometimes substantially. In Florida, for instance, the median household income for Trump voters was about $70,000, compared with $48,000 for the state as a whole. The differences are usually larger in states with substantial non-white populations, as black and Hispanic voters are overwhelmingly Democratic and tend to have lower incomes. In South Carolina, for example, the median Trump supporter had a household income of $72,000, while the median for Clinton supporters was $39,000.
Ted Cruz voters have a similar median income to Trump supporters — about $73,000. Kasich’s supporters have a very high median income, $91,000, and it has exceeded $100,000 in several states. Rubio’s voters, not displayed in the table above, followed a similar pattern to Kasich voters, with a median income of $88,000.
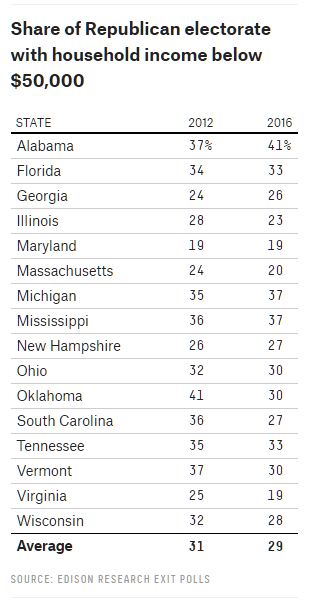
Many of the differences reflect that Republican voters are wealthier overall than Democratic ones, and also that wealthier Americans are more likely to turn out to vote, especially in the primaries. However, while Republican turnout has considerably increased overall from four years ago, there’s no sign of a particularly heavy turnout among “working-class” or lower-income Republicans. On average in states where exit polls were conducted both this year and in the Republican campaign four years ago, 29 percent of GOP voters have had household incomes below $50,000 this year, compared with 31 percent in 2012.
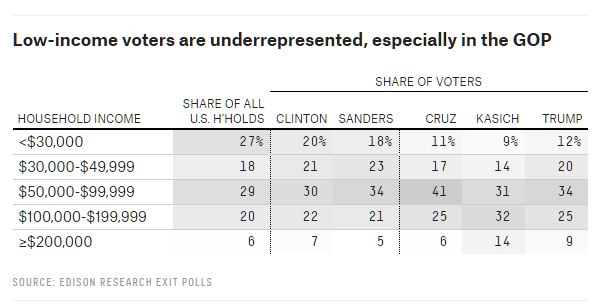
The median income for Clinton and Sanders voters — $61,000 for each candidate — is generally much closer to the overall median income in each state. But even Democratic turnout tends to skew slightly toward a wealthier electorate, somewhat validating Sanders’s claim that “poor people don’t vote.” I estimate that 27 percent of American households had incomes under $30,000 last year. By comparison, 20 percent of Clinton voters did, as did 18 percent of Sanders supporters. (Those figures imply Clinton might have a bigger edge on Sanders if more poor people voted, although it would depend on whether they were black, white or Hispanic.) Both Democratic candidates do better than the Republicans in this category, however. Only 12 percent of Trump voters have incomes below $30,000; when you also consider that Clinton has more votes than Trump overall, that means about twice as many low-income voters have cast a ballot for Clinton than for Trump so far this year.
Class in America is a complicated concept, and it may be that Trump supporters see themselves as having been left behind in other respects. Since almost all of Trump’s voters so far in the primaries have been non-Hispanic whites, we can ask whether they make lower incomes than other white Americans, for instance. The answer is “no.” The median household income for non-Hispanic whites is about $62,000,4 still a fair bit lower than the $72,000 median for Trump voters.
Likewise, although about 44 percent of Trump supporters have college degrees, according to exit polls — lower than the 50 percent for Cruz supporters or 64 percent for Kasich supporters — that’s still higher than the33 percent of non-Hispanic white adults, or the 29 percent of American adults overall, who have at least a bachelor’s degree.
This is not to say that Trump voters are happy about the condition of the economy. Substantial majorities of Republicans in every state so far have said they’re “very worried” about the condition of the U.S. economy, according to exit polls, and these voters have been more likely to vote for Trump. But that anxiety doesn’t necessarily reflect their personal economic circumstances, which for many Trump voters, at least in a relative sense, are reasonably good.
Footnotes
- Exit polls — or to be more technical, entrance polls — were also conducted for the Iowa and Nevada caucuses, but they didn’t provide the same level of detail about voters’ incomes, so I do not include them in this analysis. ^
- The main “trick” is that I use Census Bureau microdata in each state to provide more precise estimates than the exit polls’ broad ranges. Empirically, the median of an income range is not the same as its midpoint. For example, you might assume that the median income of voters in households earning between $50,000 and $100,000 a year is about $75,000. In fact, it’s closer to $70,000, although this varies somewhat from state to state. ^
- The Census Bureau’s most recent estimates of state median incomes are from 2014 and are denominated in 2014 dollars, whereas the exit poll asked voters for their 2015 incomes. As a result, I increased the Census Bureau’s estimated median incomes in each state by 3.6 percent, which is the nominal growth in U.S. GDP (not adjusted for inflation) from 2014 to 2015. ^
- This is based on adjusting the Census Bureau’s 2014 figure upward by 3.6 percent to make it comparable to 2015. ^
[Nate Silver is the founder and editor in chief of FiveThirtyEight. @natesilver538 ]
Spread the word