
Partisan gerrymandering — the practice of drawing voting districts to give one political party an unfair edge — is one of the few political issues that voters of all stripes find common cause in condemning. Voters should choose their elected officials, the thinking goes, rather than elected officials choosing their voters. The Supreme Court agrees, at least in theory: In 1986 it ruled that partisan gerrymandering, if extreme enough, is unconstitutional.
Yet in that same ruling, the court declined to strike down two Indiana maps under consideration, even though both “used every trick in the book,” according to a paper in the University of Chicago Law Review. And in the decades since then, the court has failed to throw out a single map as an unconstitutional partisan gerrymander.
“If you’re never going to declare a partisan gerrymander, what is it that’s unconstitutional?” said Wendy K. Tam Cho, a political scientist and statistician at the University of Illinois, Urbana-Champaign.
The problem is that there is no such thing as a perfect map — every map will have some partisan effect. So how much is too much? In 2004, in a ruling that rejected nearly every available test for partisan gerrymandering, the Supreme Court called this an “unanswerable question.” Meanwhile, as the court wrestles with this issue, maps are growing increasingly biased, many experts say.
Even so, the current moment is perhaps the most auspicious one in decades for reining in partisan gerrymandering. New quantitative approaches — measures of how biased a map is, and algorithms that can create millions of alternative maps — could help set a concrete standard for how much gerrymandering is too much.
Last November, some of these new approaches helped convince a United States district court to invalidate the Wisconsin state assembly district map — the first time in more than 30 years that any federal court has struck down a map for being unconstitutionally partisan. That case is now bound for the Supreme Court.
“Will the Supreme Court say, ‘Here is a fairness standard that we’re willing to stand by?’” Cho said. “If it does, that’s a big statement by the court.”
So far, political and social scientists and lawyers have been leading the charge to bring quantitative measures of gerrymandering into the legal realm. But mathematicians may soon enter the fray. A workshop being held this summer at Tufts University on the “Geometry of Redistricting” will, among other things, train mathematicians to serve as expert witnesses in gerrymandering cases. The workshop has drawn more than 1,000 applicants.
“We have just been floored at the response that we’ve gotten,” said Moon Duchin, a mathematician at Tufts who is one of the workshop’s organizers.
Lucy Reading-Ikkanda/Quanta Magazine
Quantifying Bizarreness
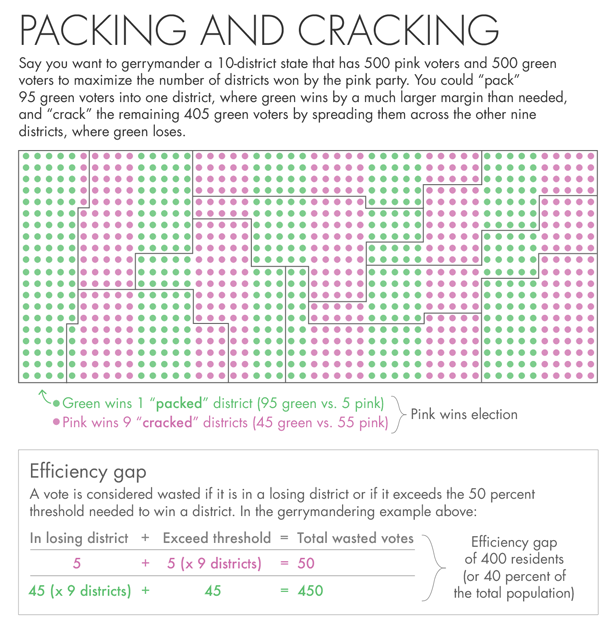
Gerrymanderers rig maps by “packing” and “cracking” their opponents. In packing, you cram many of the opposing party’s supporters into a handful of districts, where they’ll win by a much larger margin than they need. In cracking, you spread your opponent’s remaining supporters across many districts, where they won’t muster enough votes to win.
For instance, suppose you’re drawing a 10-district map for a state with 1,000 residents, who are divided evenly between Party A and Party B. You could create one district that Party A will win, 95 to 5, and nine districts that it will lose, 45 to 55. Even though the parties have equal support, Party B will win 90 percent of the seats.
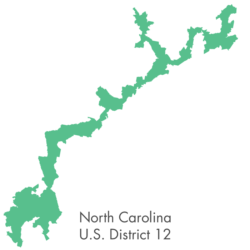
Such gerrymanders are sometimes easy to spot: To pick up the right combination of voters, cartographers may design districts that meander bizarrely. This was the case with the “salamander”-shaped district signed into law in 1812 by Massachusetts governor Elbridge Gerry — the incident that gave the practice its name. In an assortment of racial gerrymandering cases, the Supreme Court has “stated repeatedly … that crazy-looking shapes are an indicator of bad intent,” Duchin said.
Yet it’s one thing to say bizarre-looking districts are suspect, and another thing to say precisely what bizarre-looking means. Many states require that districts should be reasonably “compact” wherever possible, but there’s no one mathematical measure of compactness that fully captures what these shapes should look like. Instead, there are a variety of measures; some focus on a shape’s perimeter, others on how close the shape’s area is to that of the smallest circle around it, and still others on things like the average distance between residents.
The Supreme Court justices have “thrown up their hands,” Duchin said. “They just don’t know how to decide what shapes are too bad.”
The compactness problem will be a primary focus of the Tufts workshop. The goal is not to come up with a single compactness measure, but to bring order to the jostling crowd of contenders. The existing literature on compactness by nonmathematicians is filled with elementary errors and oversights, Duchin said, such as comparing two measures statistically without realizing that they are essentially the same measure in disguise.
Mathematicians may be able to help, but to truly make a difference, they will have to go beyond the simple models they’ve used in past papers and consider the full complexity of real-world constraints, Duchin said. The workshop’s organizers “are absolutely, fundamentally motivated by being useful to this problem,” she said. Because of the flood of interest, plans are afoot for several satellite workshops, to be held across the country over the coming year.
Ultimately, the workshop organizers hope to develop a deep bench of mathematicians with expertise in gerrymandering, to “get persuasive, well-armed mathematicians into these court conversations,” Duchin said.
The Accidental Gerrymander
A compactness rule would limit the range of tactics available for drawing unfair maps, but it would be far from a panacea. For starters, there are a lot of legitimate reasons why some districts are not compact: In many states, district maps are supposed to try to preserve natural boundaries such as rivers and county lines as well as “communities of interest,” and they must also comply with the Voting Rights Act’s protections for racial minorities. These requirements can lead to strange-looking districts — and can give cartographers latitude to gerrymander under the cover of satisfying these other constraints.

University of Illinois Board of Trustees Wendy K. Tam Cho, a political scientist and statistician at the University of Illinois, Urbana-Champaign, worked with colleagues on an algorithm that can generate millions of simulated district maps to highlight irregularities in the official map.
More fundamentally, drawing compact districts gives no guarantee that the resulting map will be fair. On the contrary, a 2013 study suggests that even when districts are required to be compact, drawing biased maps is often easy, and sometimes almost unavoidable.
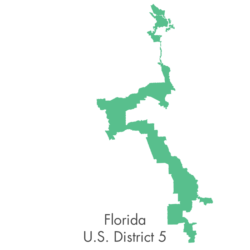
The study’s authors — political scientists Jowei Chen of the University of Michigan and Jonathan Rodden of Stanford University — examined the 2000 presidential race in Florida, where George W. Bush and Al Gore received an almost identical number of votes. Despite this perfect partisan balance, in the round of redistricting after the 2000 census, the Republican-controlled Florida legislature created a congressional district map in which Bush voters outnumbered Gore voters in 68 percent of the districts — a seemingly classic case of gerrymandering.
Yet when Chen and Rodden drew hundreds of random district maps using a nonpartisan computer algorithm, they found that their maps were biased in favor of Republicans too, sometimes as much as the official map. Democratic voters in the early 2000s, they found, were clustering into highly homogeneous neighborhoods in big cities like Miami and spreading out their remaining support in suburbs and small towns that got swallowed up inside Republican-leaning districts. They were packing and cracking themselves.
This kind of “unintentional gerrymandering” creates problems for Democrats in many of the large, urbanized states, Chen and Rodden found, although some states — such as New Jersey, in which Democratic voters are evenly spread through a large urban corridor — have population distributions that favor Democrats.
Chen and Rodden’s work indicates that biased maps can often arise even in the absence of partisan intent, and that drawing fair maps under such circumstances requires considerable care. Maps can be drawn that break up the tight city clusters, as in Illinois, where the Democratic-controlled legislature has created districts that unite segments of Chicago with suburbs and nearby rural areas.
Nevertheless, Chen and Rodden write, Democratic cartographers have a tougher job than Republican ones, who “can do strikingly well by literally choosing precincts at random.”
Wasted Votes
Since drawing compact districts is not a cure-all, solving the gerrymandering problem also requires ways to measure how biased a given map is. In a 2006 ruling, the Supreme Court offered tantalizing hints about what kind of measure it might look kindly on: one that captures the notion of “partisan symmetry,” which requires that each party have an equal opportunity to convert its votes into seats.
The court’s interest in partisan symmetry, coming after its rejection of so many other possible gerrymandering principles, represents “the most promising development in this area in decades,” wrote two researchers — Nicholas Stephanopoulos, a law professor at the University of Chicago, and Eric McGhee, a research fellow at the Public Policy Institute of California — in a 2015 paper.
In that paper, they proposed a simple measure of partisan symmetry, called the “efficiency gap,” which tries to capture just what it is that gerrymandering does. At its core, gerrymandering is about wasting your opponent’s votes: packing them where they aren’t needed and spreading them where they can’t win. So the efficiency gap calculates the difference between each party’s wasted votes, as a percentage of the total vote — where a vote is considered wasted if it is in a losing district or if it exceeds the 50 percent threshold needed in a winning district.
For instance, in our 10-district plan above, Party A wastes 45 votes in the one district it wins, and 45 votes each in the nine districts it loses, for a total of 450 wasted votes. Party B wastes only 5 votes in the district it loses, and 5 votes in each of the districts it wins, for a total of 50. That makes a difference of 400, or 40 percent of all voters. This percentage has a natural interpretation: It is the percentage of seats Party B has won beyond what it would receive in a balanced plan with an efficiency gap of zero.
Stephanopoulos and McGhee have calculated the efficiency gaps for nearly all the congressional and state legislative elections between 1972 and 2012. “The efficiency gaps of today’s most egregious plans dwarf those of their predecessors in earlier cycles,” they wrote.
The efficiency gap played a key role in the Wisconsin case, where the map in question, according to expert testimony by the political scientist Simon Jackman, had an efficiency gap of 13 percent in 2012 and 10 percent in 2014. By comparison, the average efficiency gap among state legislatures in 2012 was just over 6 percent, Stephanopoulos and McGhee have calculated.
The two have proposed the efficiency gap as the centerpiece of a simple standard the Supreme Court could adopt for partisan gerrymandering cases. To be considered an unconstitutional gerrymander, they suggest, a district plan must first be shown to exceed some chosen efficiency gap threshold, to be determined by the court. Second, since efficiency gaps tend to fluctuate over the decade that a district map is in force, the plaintiffs must show that the efficiency gap is likely to favor the same party over the entire decade, even if voter preferences shift about somewhat.
If these two requirements are met, Stephanopoulos and McGhee propose, the burden then falls to the state to explain why it created such a biased plan; perhaps, the state could argue, other considerations such as compactness and preservation of boundaries tied its hands. The plaintiffs could then rebut that claim by producing a less biased plan that performed as well as the existing map on measures like compactness.
This approach, the pair wrote, “would neatly slice the Gordian knot the Court has tied for itself,” by explicitly laying down just how much partisan effect is too much.
The Question of Intent
The efficiency gap can help to identify plans with strong partisan bias, but it cannot say whether that bias was created intentionally. To disentangle the threads of intentional and unintentional gerrymandering, last year Cho — along with her colleagues at Urbana-Champaign, senior research programmer Yan Liu and geographer Shaowen Wang — unveiled a simulation algorithm that generates a large number of maps to compare to any given districting map, to determine whether it is an outlier.
There’s an almost unfathomably large number of possible maps out there, far too many for any algorithm to fully enumerate. But by spreading their algorithm’s tasks across a massive number of processors, Cho’s team found a way to create millions or even billions of what they call “reasonably imperfect” maps — ones that perform at least as well as the original map on whatever nonpartisan measures (such as compactness) a court might be interested in. “As long as a particular facet can be quantified, we can incorporate it into our algorithm,” Cho and Liu wrote in a second paper.
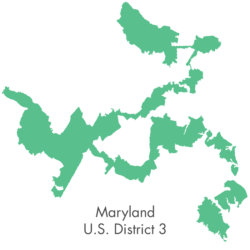
In that paper, Cho and Liu used their algorithm to draw 250 million imperfect but reasonable congressional district maps for Maryland, whose existing plan is being challenged in court. Nearly all their maps, they found, are biased in favor of Democrats. But the official plan is even more biased, favoring Democrats more strongly than 99.79 percent of the algorithm’s maps — a result extremely unlikely to occur in the absence of an intentional gerrymander.
In a similar vein, Chen and Rodden have used simulations (though with many fewer maps) to suggest that Florida’s 2012 congressional plan was almost surely intentionally gerrymandered. Their expert testimony contributed to the Florida Supreme Court’s decision in 2015 to strike down eight of the plan’s 27 districts.
“We didn’t have this level of sophistication in simulation available a decade ago, which was the last major case on this topic before the [U.S. Supreme] Court,” said Bernard Grofman, a political scientist at the University of California, Irvine.
The Florida ruling was based on the state constitution, so its implications for other states are limited. But the Wisconsin case has “potential incredible precedent value,” Grofman said.
Grofman has developed a five-pronged gerrymandering test that distills the key elements of the Wisconsin case. Three prongs are similar to those Stephanopoulos and McGhee have proposed: evidence of partisan bias, indications that the bias would likely endure for the whole decade, and the existence of at least one replacement plan that would remedy the existing plan’s bias. To these, Grofman adds two more requirements: simulations showing that the plan is an extreme outlier, suggesting that the gerrymander was intentional, and evidence that the people who made the map knew they were drawing a much more biased plan than necessary.
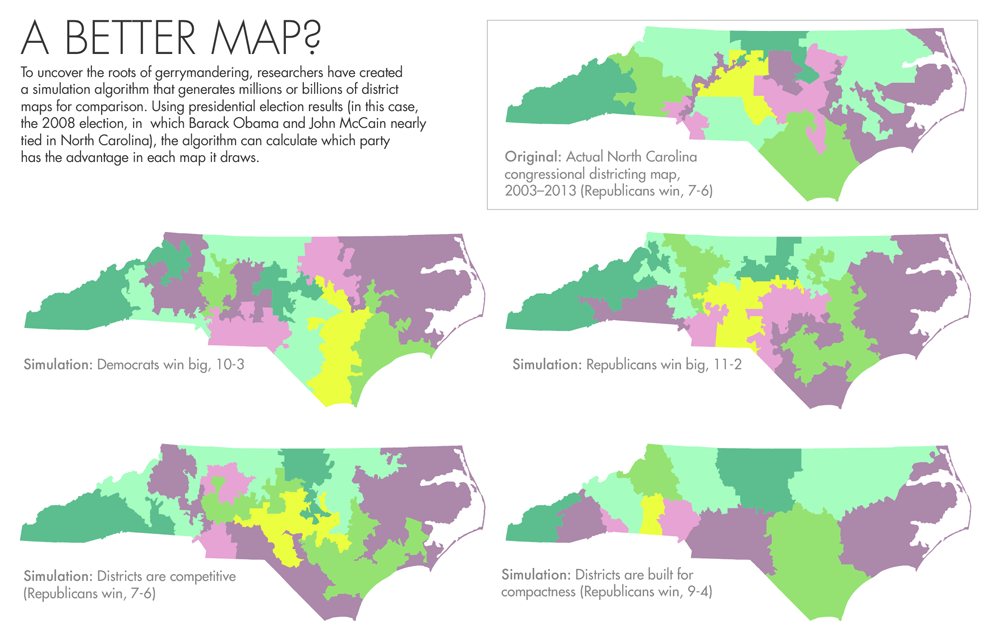
Lucy Reading-Ikkanda/Quanta Magazine; source: Wendy K. Tam Cho, using PEAR algorithm
If the Supreme Court does adopt a gerrymandering standard, it remains to be seen whether it will require evidence of intent, as Grofman’s standard does, or instead focus on outcomes, as Stephanopoulos and McGhee’s standard does.
“Do we believe that districts should come as close as possible to fair representation of the parties?” Rodden said. “If so, we shouldn’t really care about whether [gerrymandering is] intentional or unintentional.” But, he added, “I don’t know where the courts will end up coming down. I don’t think anyone knows.”
The choice has major ramifications. Last year, Chen and David Cottrell, a quantitative social scientist at Dartmouth University, used simulations to measure the extent of intentional gerrymandering in congressional district maps across most of the 50 states; they uncovered a fair bit, but they also found that on the national level, it mostly canceled out. Banning only intentional gerrymandering, they concluded, would likely have little effect on the partisan balance of the U.S. House of Representatives (although it could have a significant effect on individual state legislatures).
Banning unintentional gerrymandering as well would lead to a more radical redrawing of district maps, one that “could potentially make a very big change to the membership of the House,” McGhee said.
That decision is up to the court. But there’s plenty of work left for gerrymandering researchers, from understanding the limitations of their measures (many of which produce odd results in lopsided elections, for instance) to studying the trade-offs between ensuring partisan symmetry and, say, protecting the voting power of minorities or drawing compact districts. Collaboration between political and social scientists, mathematicians, and computer scientists is the ideal way forward, Rodden and McGhee both say.
“We should be encouraging cross-pollination and bringing in outside ideas, and then debating those ideas robustly,” McGhee said.
Quanta Magazine is committed to accurate, impartial math and basic science journalism that serves the public interest. We are an editorially independent publication with no involvement in any of the Simons Foundation's grant-giving or research efforts. Foundation-funded researchers do not receive preferential treatment and Quanta articles do not necessarily represent the views of the foundation. Learn more
Spread the word